
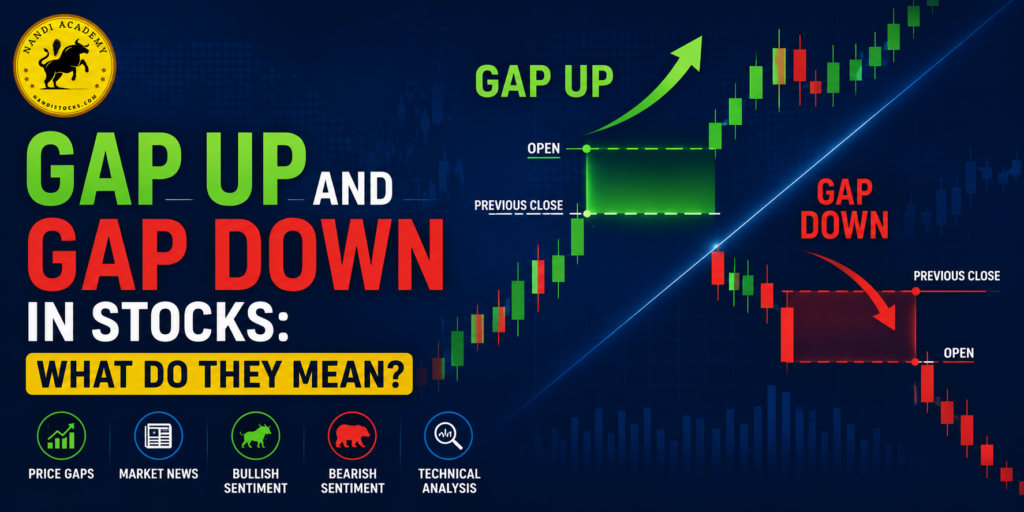
Gap Up and Gap Down in Stocks: What Do They Mean?
In the stock market, prices do not always move gradually from one level to another. Sometimes, a stock opens significantly higher or lower than its previous closing price. This sudden difference is known as a gap. A gap up happens when a stock opens above its previous day’s closing price, while a gap down occurs when it opens below the previous day’s close. Traders and investors closely watch these price gaps because they can provide important clues about market sentiment, momentum and possible trading opportunities. In this guide, we will understand what gap up and gap down mean, why they occur, the different types of gaps, and how traders can interpret them using technical analysis. What Is a Gap Up in Stocks? A gap up occurs when a stock opens at a price significantly higher than its previous closing price, leaving a visible gap on the price chart. For example, suppose a stock closes at ₹500 on Tuesday. On Wednesday, it opens at ₹525. The ₹25 difference between the previous close and the new opening price represents a gap up. What does a gap up indicate? A gap up generally indicates strong buying interest or positive market sentiment. It can happen when investors receive information that they believe will improve a company’s future prospects. Common reasons include: A gap up does not automatically mean that the stock will continue rising. Traders should examine volume, price action and the broader market before making a decision. What Is a Gap Down in Stocks? A gap down occurs when a stock opens below its previous day’s closing price. For example, if a stock closes at ₹800 and opens the next trading session at ₹760, there is a ₹40 gap down. A gap down generally reflects selling pressure or negative sentiment. Some common reasons include: Just like a gap up, a gap down should not be interpreted in isolation. The behavior of the stock after the opening is equally important. Gap Up vs Gap Down Factor Gap Up Gap Down Opening price Above previous close Below previous close Typical sentiment Bullish/positive Bearish/negative Common reason Positive news or strong demand Negative news or strong selling Possible indication Buying momentum Selling pressure Trader focus Resistance, continuation, gap filling Support, breakdown, gap filling Why Do Stocks Gap Up or Gap Down? Price gaps are usually created when there is a sudden imbalance between buyers and sellers. 1. Company News A major announcement can change how investors value a company. Strong earnings, a large order, a merger announcement or a major product launch may create buying pressure and result in a gap up. Negative developments can produce the opposite reaction. 2. Quarterly Results Earnings announcements are one of the most common triggers for price gaps. If a company’s results are much better than market expectations, buyers may enter aggressively when the market opens. Conversely, disappointing results can cause a gap down. 3. Global Market Movements Indian stocks can also react to significant movements in international markets. Major developments in global equity markets, commodities or currencies can influence investor sentiment. 4. Economic and Policy Events Interest-rate decisions, inflation data, government policies and other major economic developments can affect entire sectors and create opening gaps. 5. Institutional Activity Large buying or selling activity from institutional participants can contribute to substantial changes in opening prices, particularly in actively traded stocks. Types of Gaps in Technical Analysis Not every gap has the same meaning. Technical analysts generally classify gaps into several categories. 1. Common Gap A common gap is a relatively small gap that occurs during normal market activity and may not indicate a major change in the stock’s long-term trend. These gaps are often seen in stocks moving within a trading range. 2. Breakaway Gap A breakaway gap occurs when a stock moves out of an important consolidation zone, support area or resistance level. For example, imagine a stock has traded between ₹450 and ₹500 for several weeks. If it suddenly opens above ₹500 with strong volume and continues higher, the gap may represent a breakaway move. Breakaway gaps can be particularly important because they may signal the beginning of a new trend. 3. Runaway or Continuation Gap A runaway gap, also called a continuation gap, occurs during an established trend. If a stock is already moving strongly upward and suddenly gaps higher before continuing the trend, traders may interpret it as a sign of strong momentum. Similarly, a gap lower during a strong downtrend may indicate continued selling pressure. 4. Exhaustion Gap An exhaustion gap may occur near the end of a strong price trend. For example, after a stock has risen significantly for an extended period, it may suddenly gap higher because of aggressive buying. However, if buyers fail to sustain the move and the stock subsequently reverses, the gap could represent exhaustion rather than the beginning of another bullish phase. This is why traders should wait for confirmation rather than assuming every large gap is a continuation signal. What Is Gap Filling? One of the most commonly discussed concepts associated with price gaps is gap filling. A gap is considered to be filled when the stock later moves back through the price range created by the gap. For example, suppose a stock closes at ₹600 and opens at ₹630. If the price later falls back toward ₹600 and trades through the gap area, traders may describe the gap as being filled. However, there is no guarantee that every gap will be filled. Some gaps can remain open for a long time, particularly when they are associated with strong trends or important fundamental developments. How Traders Analyse a Gap A gap itself is only one piece of information. Traders usually combine it with other technical indicators and price-action signals. Check Trading Volume Volume can help determine how significant a gap may be. A gap up accompanied by unusually strong volume may indicate stronger participation than a gap created on relatively low volume. Identify Support and Resistance Check whether
Gap Up and Gap Down in Stocks: What Do They Mean? Read More »