AAPL 182.63 +1.23 (0.68%)
MSFT 407.54 -2.15 (0.53%)
GOOGL 156.78 +0.87 (0.56%)
AMZN 178.75 -1.32 (0.73%)
TSLA 172.63 +3.45 (2.04%)
META 465.98 +2.67 (0.58%)
NVDA 903.56 -12.34 (1.35%)

September 2026

Intraday vs Delivery Trading

Intraday vs Delivery Trading: What’s the Difference?

If you are new to the stock market, you may come across terms like intraday trading and delivery trading. While both involve buying and selling shares, the main difference is how long you hold the stocks and how the trade is settled. Understanding the difference between intraday and delivery trading can help beginners choose an approach that matches their trading or investment goals. In this guide, we will explain intraday vs delivery trading, how each works, their key differences, and what beginners should know before getting started. What Is Intraday Trading? Intraday trading means buying and selling stocks within the same trading day. The trader generally does not intend to hold the shares overnight. For example, suppose you buy 100 shares of a company at ₹500 in the morning and sell them at ₹510 later that day. The trade is completed on the same day, and the price difference determines the profit or loss before applicable charges and taxes. Intraday traders generally focus on short-term price movements and may use technical analysis, charts, market trends, and trading volumes to make decisions. Key Features of Intraday Trading What Is Delivery Trading? Delivery trading involves buying shares and holding them beyond the trading day. The shares are delivered to the investor’s demat account after settlement and can generally be held for days, months, or even years. For example, if you purchase 50 shares of a company and decide to hold them for two years, that would generally be considered delivery-based investing. Delivery trading is often used by investors who are interested in longer-term price appreciation and, where applicable, other benefits associated with owning shares, such as dividends. Key Features of Delivery Trading Intraday vs Delivery Trading: Key Differences Feature Intraday Trading Delivery Trading Holding period Usually within the same trading day More than one trading day Main focus Short-term price movements Longer-term investment Ownership Positions are generally closed before the trading day ends Shares are held in the demat account Analysis Often technical analysis and price action Often fundamental and technical analysis Time commitment Usually requires closer market monitoring Can require less frequent monitoring Market exposure Short-term Potentially longer-term Objective Seek short-term trading opportunities Build wealth or gain from longer-term price movements Risk Short-term volatility can be significant Prices can fluctuate over longer periods Intraday vs Delivery: Which Is More Suitable? There is no single approach that is suitable for every investor. The choice depends on factors such as your financial goals, time availability, risk tolerance, market knowledge and investment horizon. Intraday trading may appeal to individuals interested in actively monitoring the market and making short-term trades. Delivery-based investing may be more relevant to individuals who want to hold shares for a longer period and focus on the underlying company’s business and growth prospects. Before choosing either approach, it is important to understand how the strategy works and the risks involved. Advantages of Intraday Trading Intraday trading has several characteristics that attract active traders. Short-Term Trading Trades are generally completed within the same trading session, so positions are not intended to remain open overnight. Active Market Participation Traders can attempt to take advantage of short-term movements in stock prices. Potential Use of Margin Depending on the broker, product and applicable rules, certain intraday trades may have different margin requirements. However, margin can increase both potential gains and losses. Advantages of Delivery Trading Delivery-based investing can be useful for people who prefer a longer investment horizon. Longer Holding Period Investors can hold shares through different market cycles rather than closing positions on the same day. Focus on Company Fundamentals Long-term investors may examine factors such as revenue, profits, debt, business model, management and future growth prospects. Potential for Long-Term Growth If the underlying company performs well over time, an investor may benefit from an increase in its share price. However, returns are never guaranteed, and share prices can also decline. Risks of Intraday Trading Intraday trading can involve significant risks because stock prices can change quickly. A small price movement against a position can result in a loss. Frequent trading can also increase transaction costs. Using leverage or margin can increase the size of potential losses. Market news, volatility and unexpected price movements can also affect intraday positions. Risks of Delivery Trading Delivery trading does not eliminate risk. A stock held for several months or years can decline substantially because of poor company performance, economic conditions, industry changes or broader market movements. Holding a stock for a longer period does not guarantee a profit. Investors should research a company carefully and consider diversification and their individual financial circumstances. Intraday vs Delivery Trading: Example Suppose the share price of a company is ₹1,000. Intraday Example You buy 10 shares at ₹1,000 and sell them on the same trading day at ₹1,020. Your gross price difference would be: ₹20 × 10 = ₹200 Applicable brokerage, taxes and other charges would affect the actual result. Delivery Example You buy 10 shares at ₹1,000 and hold them for two years. If the share price later reaches ₹1,300, the price appreciation would be: ₹300 × 10 = ₹3,000 Again, this is only an illustration. Actual returns depend on the purchase and sale prices, corporate actions, charges, taxes and other factors. Can You Convert Intraday to Delivery? Depending on the broker and the specific order/product, a position may be eligible for conversion from intraday to delivery if the required conditions are met. However, conversion rules, margin requirements and applicable charges can vary between brokers. Investors should check their broker’s current terms before placing or converting an order. Intraday vs Delivery: Which One Should Beginners Understand First? Beginners should first understand how the stock market works, how orders are placed, how profits and losses are calculated, and what charges apply. It is also important to understand that intraday trading is not simply a faster version of investing. The decision-making process, risk management and time commitment can be different. Similarly, delivery investing should not be viewed as risk-free simply because

Intraday vs Delivery Trading: What’s the Difference? Read More »

pe-ratio

What Is P/E Ratio? How to Use Price-to-Earnings Ratio When Analyzing Stocks

When analyzing a company before investing, one of the most commonly used valuation metrics is the P/E ratio, or Price-to-Earnings ratio. It helps investors understand how much the market is willing to pay for each rupee of a company’s earnings. But a P/E ratio should not be used on its own. A company with a high P/E is not automatically overvalued, and a company with a low P/E is not necessarily a good investment. In this guide, we will explain what the P/E ratio means, how to calculate it, how to interpret high and low P/E ratios, and how investors can use it alongside other financial metrics when analyzing stocks. What Is the P/E Ratio? The P/E ratio (Price-to-Earnings ratio) compares a company’s current share price with its earnings per share (EPS). In simple terms, it tells you how much investors are paying for every ₹1 of the company’s earnings. P/E Ratio Formula P/E Ratio = Market Price Per Share ÷ Earnings Per Share (EPS) For example, suppose a company’s stock is trading at ₹500 per share and its earnings per share are ₹25. P/E Ratio = ₹500 ÷ ₹25 = 20 This means investors are paying ₹20 for every ₹1 the company earns. The P/E ratio is commonly used to compare companies within the same industry and to assess how the market values their earnings. What Does the P/E Ratio Tell Investors? The P/E ratio provides an indication of how much investors are willing to pay for a company’s current earnings. A higher P/E ratio can indicate that investors expect the company’s earnings to grow in the future. However, it can also mean that the stock is expensive relative to its current earnings. A lower P/E ratio may indicate that the stock is relatively inexpensive compared with its earnings. But it could also reflect slower growth expectations, business risks, poor financial performance, or other concerns. Therefore, P/E should be treated as a starting point for analysis rather than a standalone buy-or-sell signal. How to Calculate P/E Ratio Calculating the P/E ratio is relatively simple. Step 1: Find the Current Share Price Take the current market price of the company’s share. For example: Share price = ₹600 Step 2: Find the Earnings Per Share Suppose the company’s EPS is: EPS = ₹30 Step 3: Apply the Formula P/E = ₹600 ÷ ₹30 P/E = 20 Therefore, the company has a P/E ratio of 20. Investors can find share prices and financial information through stock exchanges, company filings, annual reports and reliable financial-data platforms. What Is a High P/E Ratio? A high P/E ratio means investors are paying a relatively high price compared with the company’s current earnings. For example, if Company A has a P/E of 40 and Company B has a P/E of 15, Company A has a much higher valuation relative to its current earnings. A high P/E may occur because: A high P/E is therefore not automatically bad. The important question is whether the company’s expected growth and financial performance justify that valuation. What Is a Low P/E Ratio? A low P/E ratio means the company’s share price is relatively low compared with its earnings. A low P/E can sometimes indicate an attractive valuation, but it can also indicate that investors have concerns about the company’s future. Possible reasons include: This is why investors should investigate why a company’s P/E is low rather than assuming that a low P/E automatically means the stock is cheap. What Is a Good P/E Ratio? There is no single P/E ratio that can be considered “good” for every company. A reasonable P/E depends on factors such as: For example, technology or other growth-oriented companies may trade at higher P/E multiples because investors expect stronger future earnings growth. Mature businesses with slower growth may trade at lower multiples. The best approach is to compare a company’s P/E with similar companies in the same industry and with its own historical valuation. How to Use P/E Ratio When Analyzing Stocks P/E becomes more useful when you use it as part of a broader stock-analysis process. 1. Compare Companies in the Same Industry Suppose two companies operate in the same industry: Company P/E Ratio Company A 18 Company B 28 Company C 35 Company A has the lowest P/E, but that does not automatically make it the best investment. You should investigate their revenue growth, profit growth, debt, margins, return on equity and future prospects before drawing a conclusion. 2. Compare the Company’s Historical P/E You can also compare a company’s current P/E with its historical valuation. If a company has traditionally traded around a P/E of 20 but is currently trading at 30, investors may want to investigate why the valuation has increased. Similarly, a lower-than-usual P/E may deserve further analysis. Historical comparison can provide useful context, but it should not be treated as a guaranteed indicator of future returns. 3. Compare P/E With Earnings Growth P/E should ideally be considered alongside earnings growth. A company with a high P/E but rapidly growing earnings may have a different valuation profile from a company with the same P/E but stagnant earnings. This is one reason investors sometimes consider metrics such as the PEG ratio, which relates valuation to expected earnings growth. 4. Look at Other Financial Ratios P/E is only one part of fundamental analysis. Investors may also examine: Looking at several metrics can provide a more complete picture of a company’s financial position and valuation. Trailing P/E vs Forward P/E There are two commonly discussed types of P/E ratios. Trailing P/E Trailing P/E uses the company’s earnings from a previous period, typically based on historical earnings. Trailing P/E = Current Share Price ÷ Historical EPS It reflects what the company has already earned. Forward P/E Forward P/E uses estimated future earnings. Forward P/E = Current Share Price ÷ Expected Future EPS It can help investors understand how the current valuation compares with expected future earnings. However, forward earnings are estimates and can be

What Is P/E Ratio? How to Use Price-to-Earnings Ratio When Analyzing Stocks Read More »

Futures vs Options

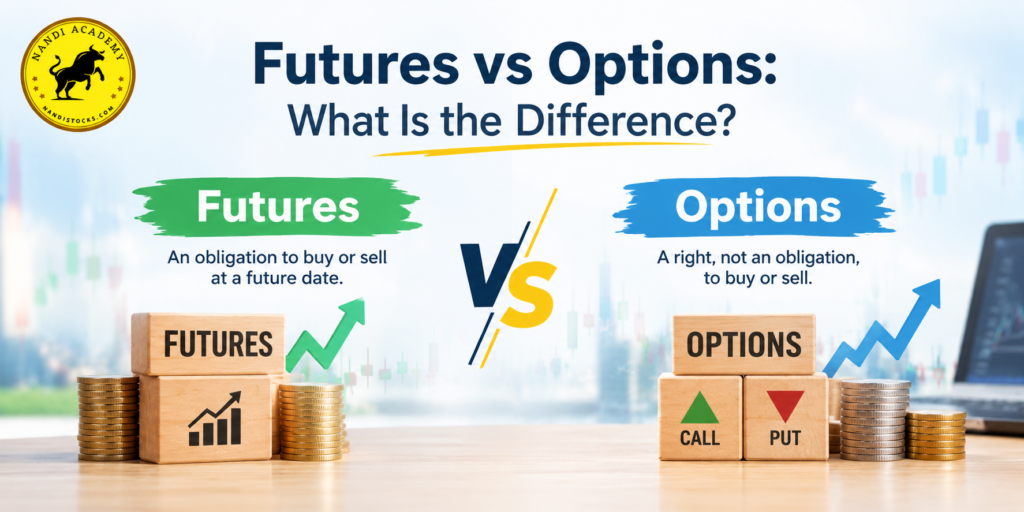
Futures vs Options: What Is the Difference?

Futures and options are two popular types of derivatives used in the stock market. Both allow traders and investors to take positions based on the future movement of an underlying asset such as stocks, indices, commodities, or currencies. However, they work differently and involve different levels of risk, cost, and obligation. Understanding the difference between futures and options is important before entering the derivatives market. This guide explains futures vs options in simple terms and highlights how they differ in terms of obligation, risk, investment, profit potential, and trading strategy. What Are Futures? A futures contract is an agreement between two parties to buy or sell an underlying asset at a predetermined price on a specified future date. When you trade futures, you are taking an obligation to fulfil the contract according to its terms. You do not normally pay the entire value of the underlying position upfront. Instead, a margin is required to take the position. For example, suppose you expect the price of an index to rise. You can take a long futures position. If the index rises as expected, you may make a profit. However, if it moves against your position, you can also face significant losses. Futures are commonly used for: What Are Options? An options contract gives the buyer the right, but not the obligation, to buy or sell an underlying asset at a predetermined price within or at a specified time, depending on the contract type. There are two main types of options: Unlike a futures contract, an option buyer can choose not to exercise the contract if the trade does not move in their favour. The buyer pays a premium for this right. For example, if you purchase a call option because you expect a stock or index to rise, your potential loss as an option buyer is generally limited to the premium paid, although the exact risk depends on the strategy used. Futures vs Options: Key Differences The biggest difference between futures and options is the obligation involved. Feature Futures Options Contract type Agreement to buy or sell Right, but not obligation, for the buyer Obligation Both parties have obligations Option buyer has no obligation to exercise Initial cost Margin is required Buyer pays a premium Risk Can be substantial for both long and short positions Option buyer’s loss is generally limited to premium paid Profit potential Can be significant depending on price movement Depends on the option and strategy Time value Not applicable in the same way as options Important factor Main types Futures contracts Call and Put options Complexity Relatively straightforward Can be more complex Common uses Trading and hedging Hedging, income strategies and directional trading Futures vs Options: How Risk Works Risk is one of the most important factors to understand before trading derivatives. With futures, both profits and losses can increase as the underlying asset moves. For example, if you take a long futures position and the underlying price falls significantly, your losses can increase accordingly. Options work differently. If you buy an option, the maximum loss is generally the premium paid for that option, assuming you hold only that long option position. However, option sellers can face substantially higher risks, depending on the position and whether it is hedged. This is why traders should understand position sizing, stop-loss strategies, margin requirements and risk management before trading derivatives. Futures vs Options: Which Requires More Capital? The capital requirement depends on the contract, broker, market conditions and trading strategy. A futures trader generally needs to maintain the required margin to hold a position. Although the trader does not pay the entire contract value upfront, the position can have significant exposure to the underlying asset. An option buyer pays a premium to purchase the option. The premium can be considerably lower than the total value of the underlying asset, but it can also lose value quickly because of factors such as time decay and changes in implied volatility. Therefore, a lower upfront cost does not automatically mean that options are easier or safer to trade. Futures vs Options: Profit Potential Both futures and options can provide opportunities to profit from market movements, but the way profits are generated is different. In a futures trade, the profit or loss generally changes directly with the movement of the underlying asset, based on the contract specifications. For an option buyer, the underlying asset needs to move sufficiently in the expected direction to overcome the premium paid and other factors affecting the option’s value. Options can also be used to construct different strategies involving calls and puts. These strategies can be designed for bullish, bearish, neutral or hedging purposes. When Should You Consider Futures? Futures may be suitable for traders who: However, futures are not automatically suitable for beginners. Leverage can increase both potential gains and potential losses. When Should You Consider Options? Options may be useful for traders and investors who understand how premiums, expiry, volatility and time decay work. Options can be used for: However, options trading can become complex quickly, particularly when multiple contracts are combined into a strategy. Futures vs Options: Which Is Better? There is no single answer to whether futures or options are better. The right choice depends on your objective, risk tolerance, market view, capital, experience and trading strategy. Futures may be more suitable when you want direct exposure to price movements and understand margin-based trading. Options may be more suitable when you want flexibility or want to use strategies where risk can be defined, particularly for option buyers. The important point is not to choose a derivative simply because it requires less initial capital. You should understand how the contract works and what can happen if the market moves against your position. Futures vs Options for Beginners Beginners should first understand the basics of the stock market before moving into derivatives. Before trading futures or options, learn about: A strong understanding of these concepts can help traders make more informed decisions and avoid taking excessive

Futures vs Options: What Is the Difference? Read More »

Gap Up and Gap Down in Stocks

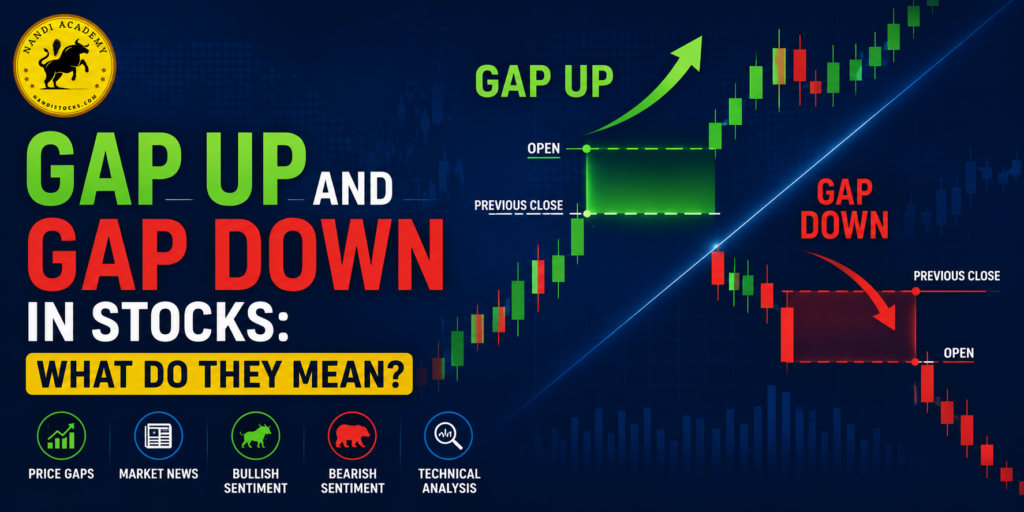
Gap Up and Gap Down in Stocks: What Do They Mean?

In the stock market, prices do not always move gradually from one level to another. Sometimes, a stock opens significantly higher or lower than its previous closing price. This sudden difference is known as a gap. A gap up happens when a stock opens above its previous day’s closing price, while a gap down occurs when it opens below the previous day’s close. Traders and investors closely watch these price gaps because they can provide important clues about market sentiment, momentum and possible trading opportunities. In this guide, we will understand what gap up and gap down mean, why they occur, the different types of gaps, and how traders can interpret them using technical analysis. What Is a Gap Up in Stocks? A gap up occurs when a stock opens at a price significantly higher than its previous closing price, leaving a visible gap on the price chart. For example, suppose a stock closes at ₹500 on Tuesday. On Wednesday, it opens at ₹525. The ₹25 difference between the previous close and the new opening price represents a gap up. What does a gap up indicate? A gap up generally indicates strong buying interest or positive market sentiment. It can happen when investors receive information that they believe will improve a company’s future prospects. Common reasons include: A gap up does not automatically mean that the stock will continue rising. Traders should examine volume, price action and the broader market before making a decision. What Is a Gap Down in Stocks? A gap down occurs when a stock opens below its previous day’s closing price. For example, if a stock closes at ₹800 and opens the next trading session at ₹760, there is a ₹40 gap down. A gap down generally reflects selling pressure or negative sentiment. Some common reasons include: Just like a gap up, a gap down should not be interpreted in isolation. The behavior of the stock after the opening is equally important. Gap Up vs Gap Down Factor Gap Up Gap Down Opening price Above previous close Below previous close Typical sentiment Bullish/positive Bearish/negative Common reason Positive news or strong demand Negative news or strong selling Possible indication Buying momentum Selling pressure Trader focus Resistance, continuation, gap filling Support, breakdown, gap filling Why Do Stocks Gap Up or Gap Down? Price gaps are usually created when there is a sudden imbalance between buyers and sellers. 1. Company News A major announcement can change how investors value a company. Strong earnings, a large order, a merger announcement or a major product launch may create buying pressure and result in a gap up. Negative developments can produce the opposite reaction. 2. Quarterly Results Earnings announcements are one of the most common triggers for price gaps. If a company’s results are much better than market expectations, buyers may enter aggressively when the market opens. Conversely, disappointing results can cause a gap down. 3. Global Market Movements Indian stocks can also react to significant movements in international markets. Major developments in global equity markets, commodities or currencies can influence investor sentiment. 4. Economic and Policy Events Interest-rate decisions, inflation data, government policies and other major economic developments can affect entire sectors and create opening gaps. 5. Institutional Activity Large buying or selling activity from institutional participants can contribute to substantial changes in opening prices, particularly in actively traded stocks. Types of Gaps in Technical Analysis Not every gap has the same meaning. Technical analysts generally classify gaps into several categories. 1. Common Gap A common gap is a relatively small gap that occurs during normal market activity and may not indicate a major change in the stock’s long-term trend. These gaps are often seen in stocks moving within a trading range. 2. Breakaway Gap A breakaway gap occurs when a stock moves out of an important consolidation zone, support area or resistance level. For example, imagine a stock has traded between ₹450 and ₹500 for several weeks. If it suddenly opens above ₹500 with strong volume and continues higher, the gap may represent a breakaway move. Breakaway gaps can be particularly important because they may signal the beginning of a new trend. 3. Runaway or Continuation Gap A runaway gap, also called a continuation gap, occurs during an established trend. If a stock is already moving strongly upward and suddenly gaps higher before continuing the trend, traders may interpret it as a sign of strong momentum. Similarly, a gap lower during a strong downtrend may indicate continued selling pressure. 4. Exhaustion Gap An exhaustion gap may occur near the end of a strong price trend. For example, after a stock has risen significantly for an extended period, it may suddenly gap higher because of aggressive buying. However, if buyers fail to sustain the move and the stock subsequently reverses, the gap could represent exhaustion rather than the beginning of another bullish phase. This is why traders should wait for confirmation rather than assuming every large gap is a continuation signal. What Is Gap Filling? One of the most commonly discussed concepts associated with price gaps is gap filling. A gap is considered to be filled when the stock later moves back through the price range created by the gap. For example, suppose a stock closes at ₹600 and opens at ₹630. If the price later falls back toward ₹600 and trades through the gap area, traders may describe the gap as being filled. However, there is no guarantee that every gap will be filled. Some gaps can remain open for a long time, particularly when they are associated with strong trends or important fundamental developments. How Traders Analyse a Gap A gap itself is only one piece of information. Traders usually combine it with other technical indicators and price-action signals. Check Trading Volume Volume can help determine how significant a gap may be. A gap up accompanied by unusually strong volume may indicate stronger participation than a gap created on relatively low volume. Identify Support and Resistance Check whether

Gap Up and Gap Down in Stocks: What Do They Mean? Read More »

Want to grow your money smartly?

🚀 Learn Trading | 📊 Master Stock Market Skills | 💡 Get Expert Mentorship