
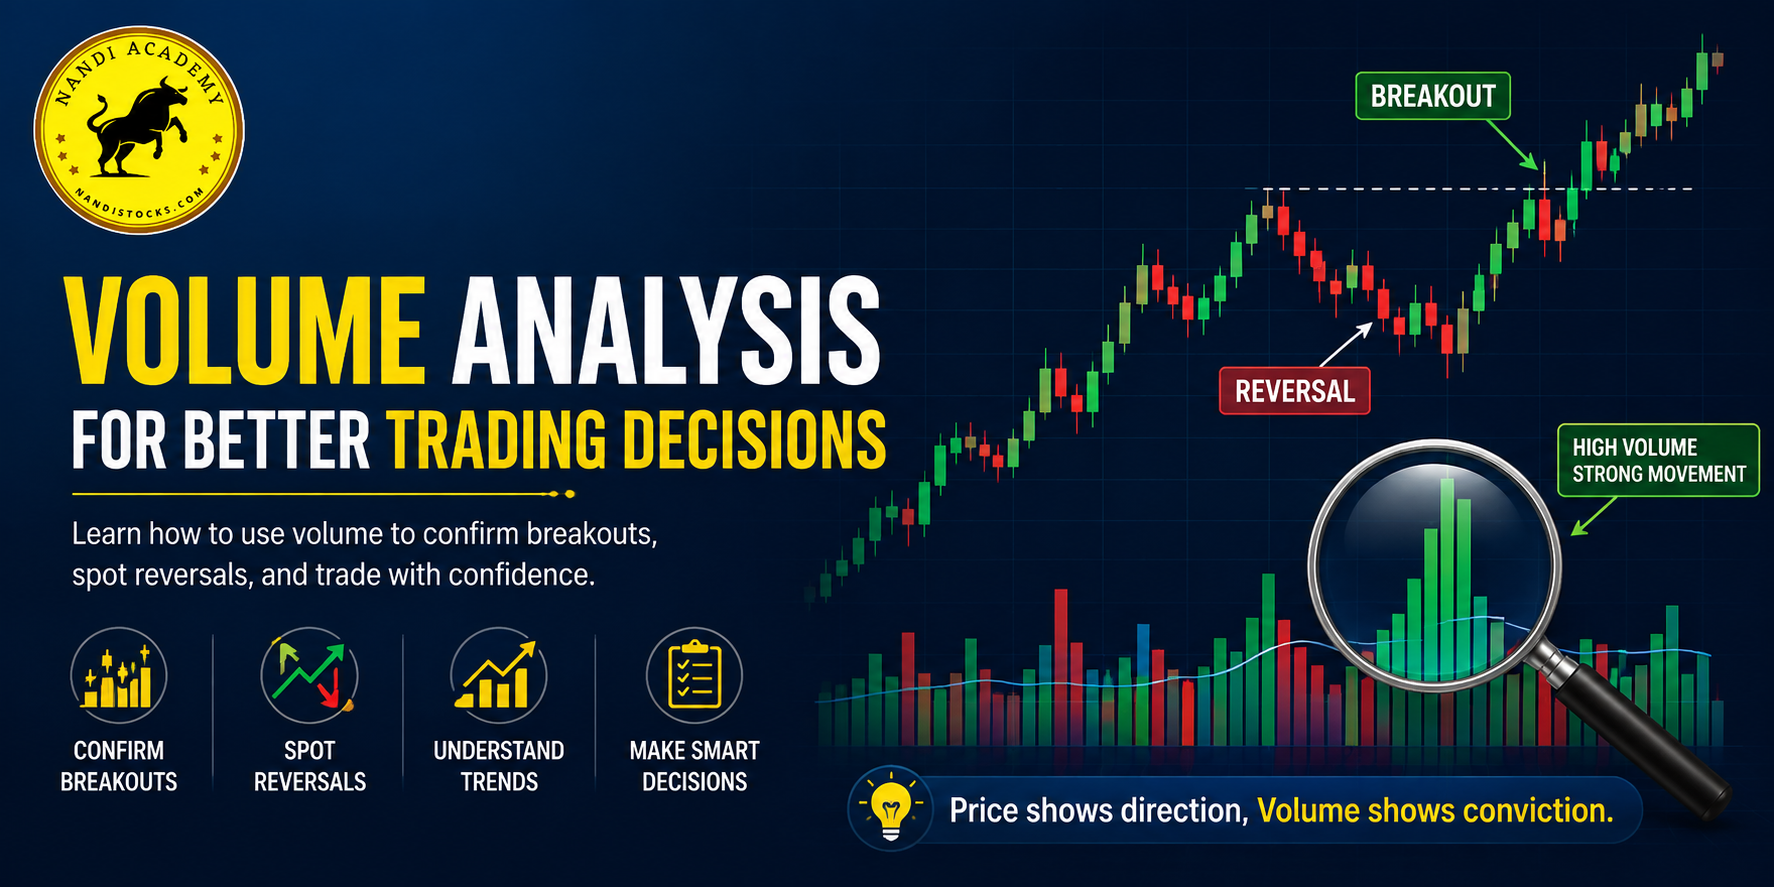
Volume analysis is one of the most useful tools in technical analysis. While price tells traders what a stock is doing, volume provides additional insight into how much participation is behind that price movement.
A rise in price accompanied by strong trading volume can indicate increased buying interest, while a price movement on very low volume may suggest weaker participation. By combining volume with price action, support and resistance, and other technical indicators, traders can make more informed decisions.
In this guide, we will understand what volume means, why it matters, how to interpret volume with price movements, and how traders can use it to identify potential breakouts and trend reversals.
What Is Trading Volume?
Trading volume refers to the number of shares or contracts traded during a specific period.
For example, if 500,000 shares of a company are exchanged during a trading session, the volume for that session is 500,000 shares.
Volume can be displayed at different time intervals, such as:
- 1-minute charts
- 5-minute charts
- 15-minute charts
- Hourly charts
- Daily charts
- Weekly charts
The appropriate timeframe depends on whether you are a scalper, intraday trader, swing trader, or long-term investor.
Why Is Volume Important?
Price movement alone doesn’t always tell the complete story.
Suppose a stock rises by 5%. If the movement occurs with significantly higher-than-average volume, it may indicate strong market participation.
On the other hand, if the same 5% increase happens with unusually low volume, traders may want to investigate whether the move has enough participation to sustain itself.
Therefore, volume can help traders evaluate the strength and conviction behind price movements.
How Does Volume Analysis Work?
Volume analysis involves studying the relationship between price and trading volume.
Traders generally look for situations where volume confirms or contradicts price action.
For example:
Price ↑ + Volume ↑ = Potentially strong buying interest
Price ↓ + Volume ↑ = Potentially strong selling pressure
Price ↑ + Volume ↓ = Move may have weaker participation
Price ↓ + Volume ↓ = Selling pressure may be weakening
These are general observations rather than guaranteed trading signals. Volume should always be considered alongside the broader market context.
1. Use Volume to Confirm Breakouts
One of the most popular applications of volume analysis is breakout confirmation.
Imagine a stock has been trading between ₹900 and ₹1,000 for several weeks. The ₹1,000 level acts as resistance.
If the stock suddenly moves above ₹1,000 with significantly higher-than-average volume, the breakout may have greater credibility than a breakout occurring on very low volume.
Example
Suppose:
- Resistance = ₹1,000
- Stock breaks to ₹1,025
- Average volume = 500,000 shares
- Breakout-day volume = 1.5 million shares
The substantial increase in volume indicates that many more market participants were involved in the move.
However, traders should still watch whether the price can sustain itself above the breakout level.
2. Identify Weak Breakouts
Not every breakout is genuine.
Sometimes a stock moves above resistance briefly and then falls back below it. This can create a false breakout.
Volume can provide an additional clue.
If the price breaks resistance but volume remains unusually weak, traders may become more cautious.
For example:
Resistance → ₹500
The stock moves to ₹510 but trading volume remains below its normal average.
Instead of immediately entering a trade, a trader might wait for:
- Stronger volume
- Price confirmation
- A successful retest
- Support above the previous resistance
This approach can help reduce impulsive decisions.
3. Understand Volume During Uptrends
In a healthy uptrend, traders often look for periods where rising prices are supported by increasing or healthy volume.
For example:
Price: Higher High → Higher High → Higher High
Volume: Strong participation during major upward moves
This can suggest that buyers remain interested.
However, volume doesn’t need to increase on every single upward candle. Traders should focus on the overall relationship between price and volume.
4. Analyze Volume During Downtrends
Volume can also help traders understand downward movements.
When a stock falls sharply with unusually high volume, it may indicate significant selling pressure.
For example:
- Stock falls 4%
- Volume is 2× its average
- Price closes near the day’s low
This combination may indicate strong participation from sellers.
However, high volume during a decline doesn’t automatically mean that the stock will continue falling. It could also represent panic selling, institutional activity, or potential accumulation.
Context is critical.
5. Use Volume to Spot Potential Reversals
Volume can sometimes provide clues when a trend is losing momentum.
Suppose a stock has been falling for several weeks. Suddenly, it experiences:
- A sharp decline
- Extremely high volume
- Strong recovery from the day’s low
- A bullish closing candle
This could indicate that substantial buying interest has appeared.
Some traders refer to such situations as potential selling climax or accumulation zones.
However, one high-volume candle isn’t enough to confirm a reversal. Traders should wait for additional price confirmation.
6. Understand Volume Spikes
A volume spike occurs when trading volume suddenly becomes much higher than normal.
Volume spikes can happen because of:
- Company results
- Major announcements
- Corporate actions
- Economic news
- Sector developments
- Institutional buying or selling
- Market-wide events
A volume spike becomes particularly interesting when it occurs near important technical levels.
For example, a stock approaching resistance may experience a significant volume increase.
If the stock then breaks resistance and maintains the higher price levels, the volume spike can provide additional confirmation.
7. Compare Current Volume With Average Volume
Looking at volume alone isn’t always useful.
A better approach is to compare current volume with average volume.
For example:
A stock normally trades 200,000 shares per day.
Today it trades 800,000 shares.
The current volume is approximately four times its normal level.
This makes the volume more significant than simply saying that 800,000 shares were traded.
Relative Volume
Traders often use Relative Volume (RVOL) to compare current trading activity with typical volume.
A higher RVOL may indicate unusually strong market activity.
However, the interpretation depends on the stock, timeframe, and market conditions.
8. Volume and Support Levels
Volume can also be useful around support zones.
Suppose a stock has repeatedly found support around ₹750.
The stock falls toward ₹750 and suddenly experiences:
- Increased volume
- Strong buying response
- Bullish price rejection
This combination may suggest that buyers are defending the level.
Traders may then watch for confirmation before considering a potential trade.
The important point is that volume should support the price action rather than replace it.
9. Volume and Resistance Levels
The same concept applies to resistance.
Suppose ₹1,200 has acted as resistance several times.
If the stock approaches ₹1,200 with increasing volume and eventually closes above it, traders may view the move as more significant.
But if the stock repeatedly touches ₹1,200 and gets rejected despite high volume, it may indicate strong selling interest around that level.
10. Popular Volume Indicator
Traders can use several indicators to analyze volume.
Volume Bars
The simplest method is to display volume below the price chart.
This allows traders to compare current trading activity with previous periods.
Volume Moving Average
A moving average of volume can help traders determine whether current volume is above or below normal levels.
On-Balance Volume (OBV)
On-Balance Volume (OBV) combines price direction with volume to track buying and selling pressure.
Traders sometimes use OBV to identify potential divergences between price and volume trends.
Volume Profile
Volume Profile displays trading volume across different price levels rather than simply across time.
It can help traders identify areas where substantial trading activity has occurred.
Volume Divergence: What Does It Mean?
A volume divergence occurs when price and volume don’t appear to support each other.
For example, a stock may continue making higher highs while volume gradually declines.
This doesn’t automatically mean that the stock will reverse.
However, it can indicate that traders should pay closer attention to the trend and look for additional confirmation.
Similarly, if price is declining while selling volume begins to weaken, traders may watch for signs that the downward momentum is losing strength.
Common Mistakes When Using Volume Analysis
Volume is powerful, but beginners often make mistakes when interpreting it.
1. Treating High Volume as a Buy Signal
High volume simply means that significant trading activity occurred.
It doesn’t automatically mean buyers are winning.
2. Ignoring Price Action
Volume should generally be analyzed alongside price.
A volume spike without understanding the corresponding price movement can be misleading.
3. Trading Every Volume Spike
Not every unusual volume event creates a trading opportunity.
News-driven spikes can produce significant volatility.
4. Ignoring Market Context
A stock may show high volume because the entire market or sector is moving.
Always consider broader market conditions.
5. Using Volume as a Standalone Indicator
Volume works best when combined with tools such as:
- Support and resistance
- Candlestick patterns
- Moving averages
- Price action
- Trend analysis
- Risk management
A Simple Volume Analysis Strategy for Beginners
Beginners can follow a straightforward process.
Step 1: Identify the Trend
Determine whether the stock is:
- Trending upward
- Trending downward
- Moving sideways
Step 2: Mark Important Levels
Identify major support and resistance zones.
Step 3: Observe Average Volume
Understand what normal trading activity looks like for the stock.
Step 4: Watch for Volume Changes
Look for unusual increases or decreases in volume around important price levels.
Step 5: Wait for Price Confirmation
Don’t enter a trade simply because volume increased.
Look for confirmation from price action.
Step 6: Manage Risk
Always consider:
- Stop loss
- Position size
- Risk-reward ratio
- Overall market conditions
This helps prevent a single trade from having an outsized impact on your trading capital.
Volume Analysis vs Price Action
Price action tells you what price is doing.
Volume gives you additional information about the level of market participation behind that movement.
Using both together can provide a more complete picture.
For example:
Price breaks resistance + high volume + strong close
This may provide stronger confirmation than:
Price breaks resistance + very low volume
Again, these are observations—not guaranteed outcomes.
Final Thoughts
Volume analysis can be a valuable part of a trader’s technical-analysis toolkit. By studying the relationship between price and volume, traders can better understand breakouts, trend strength, potential reversals, support and resistance, and unusual market activity.
However, volume should not be treated as a standalone buy or sell signal. The most effective approach is to combine volume with price action, technical indicators, market context, and disciplined risk management.
For beginners, the best way to improve volume-analysis skills is through consistent chart observation and practical learning. Understanding why volume changes—not simply noticing that it changed—can help develop stronger technical-analysis skills over time.
Want to learn technical analysis from the basics to advanced concepts? Explore structured stock market education and practical technical-analysis training with Nandi Stocks.